| Figure 19 |
 |
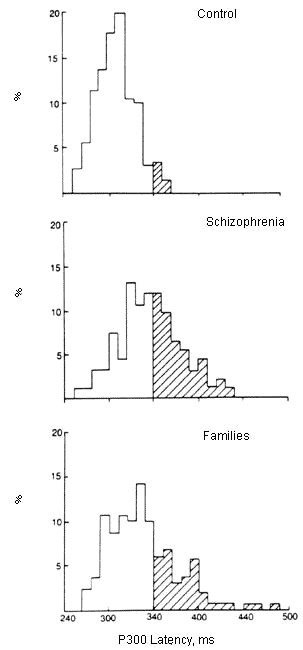
| Distribution of P300 latency in normal controls, schizophrenics, and their families. As with eye tracking scores in the same individuals (Fig. 1), the distributions are normal in the normals and schizophrenics and bimodal in the families. However, the two abnormalities sorted independently in the families. (From ref. 12) |
| Back to Chapter |
published 2000