| FIG. 4 |
|
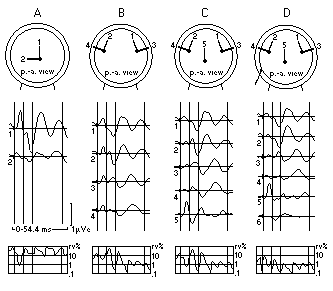
| Dipole source potentials and residual variance (RV) as evaluated from the data in Fig. 3 by hypothetical models A to D. Vertical bars mark the latency intervals 110 msec, 1019 msec, and 1949 msec. A shows that a central source is necessary to account for activity in the first interval as seen by a dip in RV. B shows that bilateral temporal pole sources account for considerable variance in the second interval, and D that adding a unilateral scalp source (due to myogenic reflex activity) gives a better solution than C, which is based on the results of A and B together. From Scherg (63). |
| Back to Chapter |
published 2000