| Figure 12 |
 |
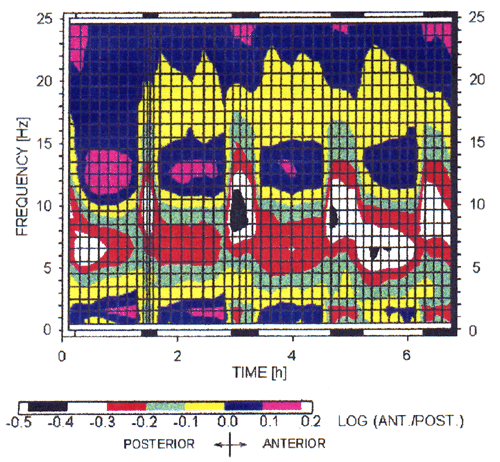
| Synopsis of the topographic EEG power gradients along the antero-posterior axis. Color coded ratio of power (log transformed) between the F3-C3 and P3-O1 derivation as a function of time and frequency. Individual nonREM sleep episodes were subdivided into 7 equal intervals, REM sleep episodes into 4 intervals, and the time between lights-off and sleep onset was represented as 1 interval. Data were aligned with respect to sleep onset (cycle 1) or with respect to the first occurrence of stage 2 after a REM sleep episode (cycles 2–4). REM sleep is indicated by horizontal black bars on top and at the bottom. Note that there is a modulation by the nonREM-REM sleep cycle as well as frequency-specific changes across and within nonREM sleep episodes. An antero-posterior shift in the SWA range is present across consecutive episodes. (Adapted from ref. 124). |
| Back to Chapter |
published 2000